Mapping
Visualize global energy infrastructure with our advanced mapping platform. Gain spatial intelligence to support strategic planning, competitive analysis, and business development initiatives.
Our Mapping Methodology
GEI Mapping combines verified asset data with advanced geospatial technology to provide the most accurate and comprehensive view of global energy infrastructure.
Verified Coordinates
Every asset location is verified through multiple sources including satellite imagery, regulatory filings, and operator validation.
Rich Asset Attributes
Each point or line on the map links to comprehensive asset data including capacity, ownership, status, and technical specifications.
Continuous Updates
The map is continuously updated with new projects, capacity changes, and ownership transfers as they occur.


Geospatial Intelligence for a Changing Sector
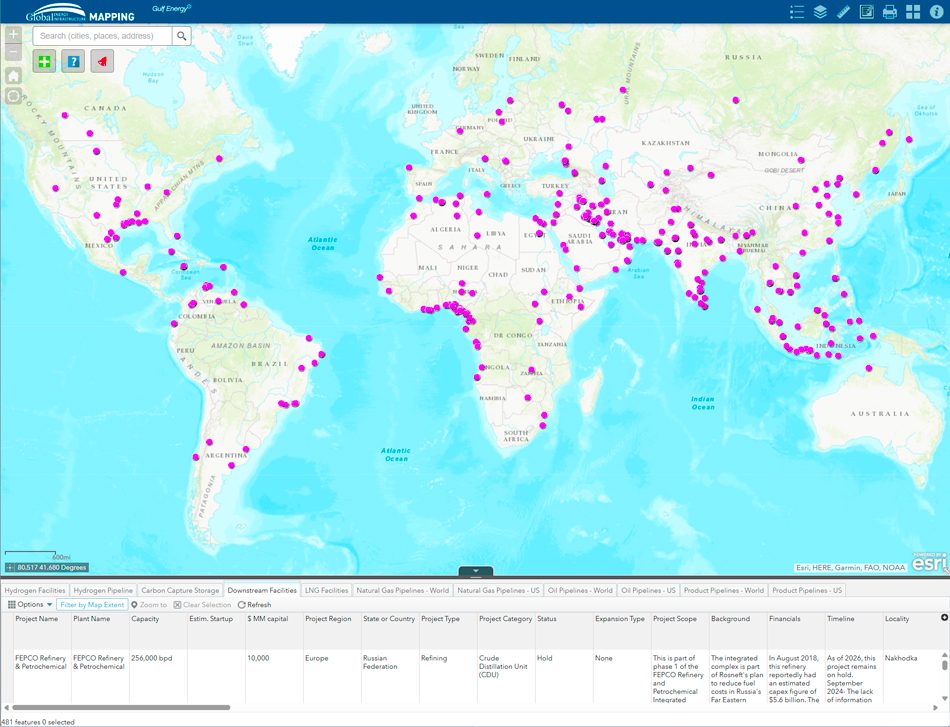
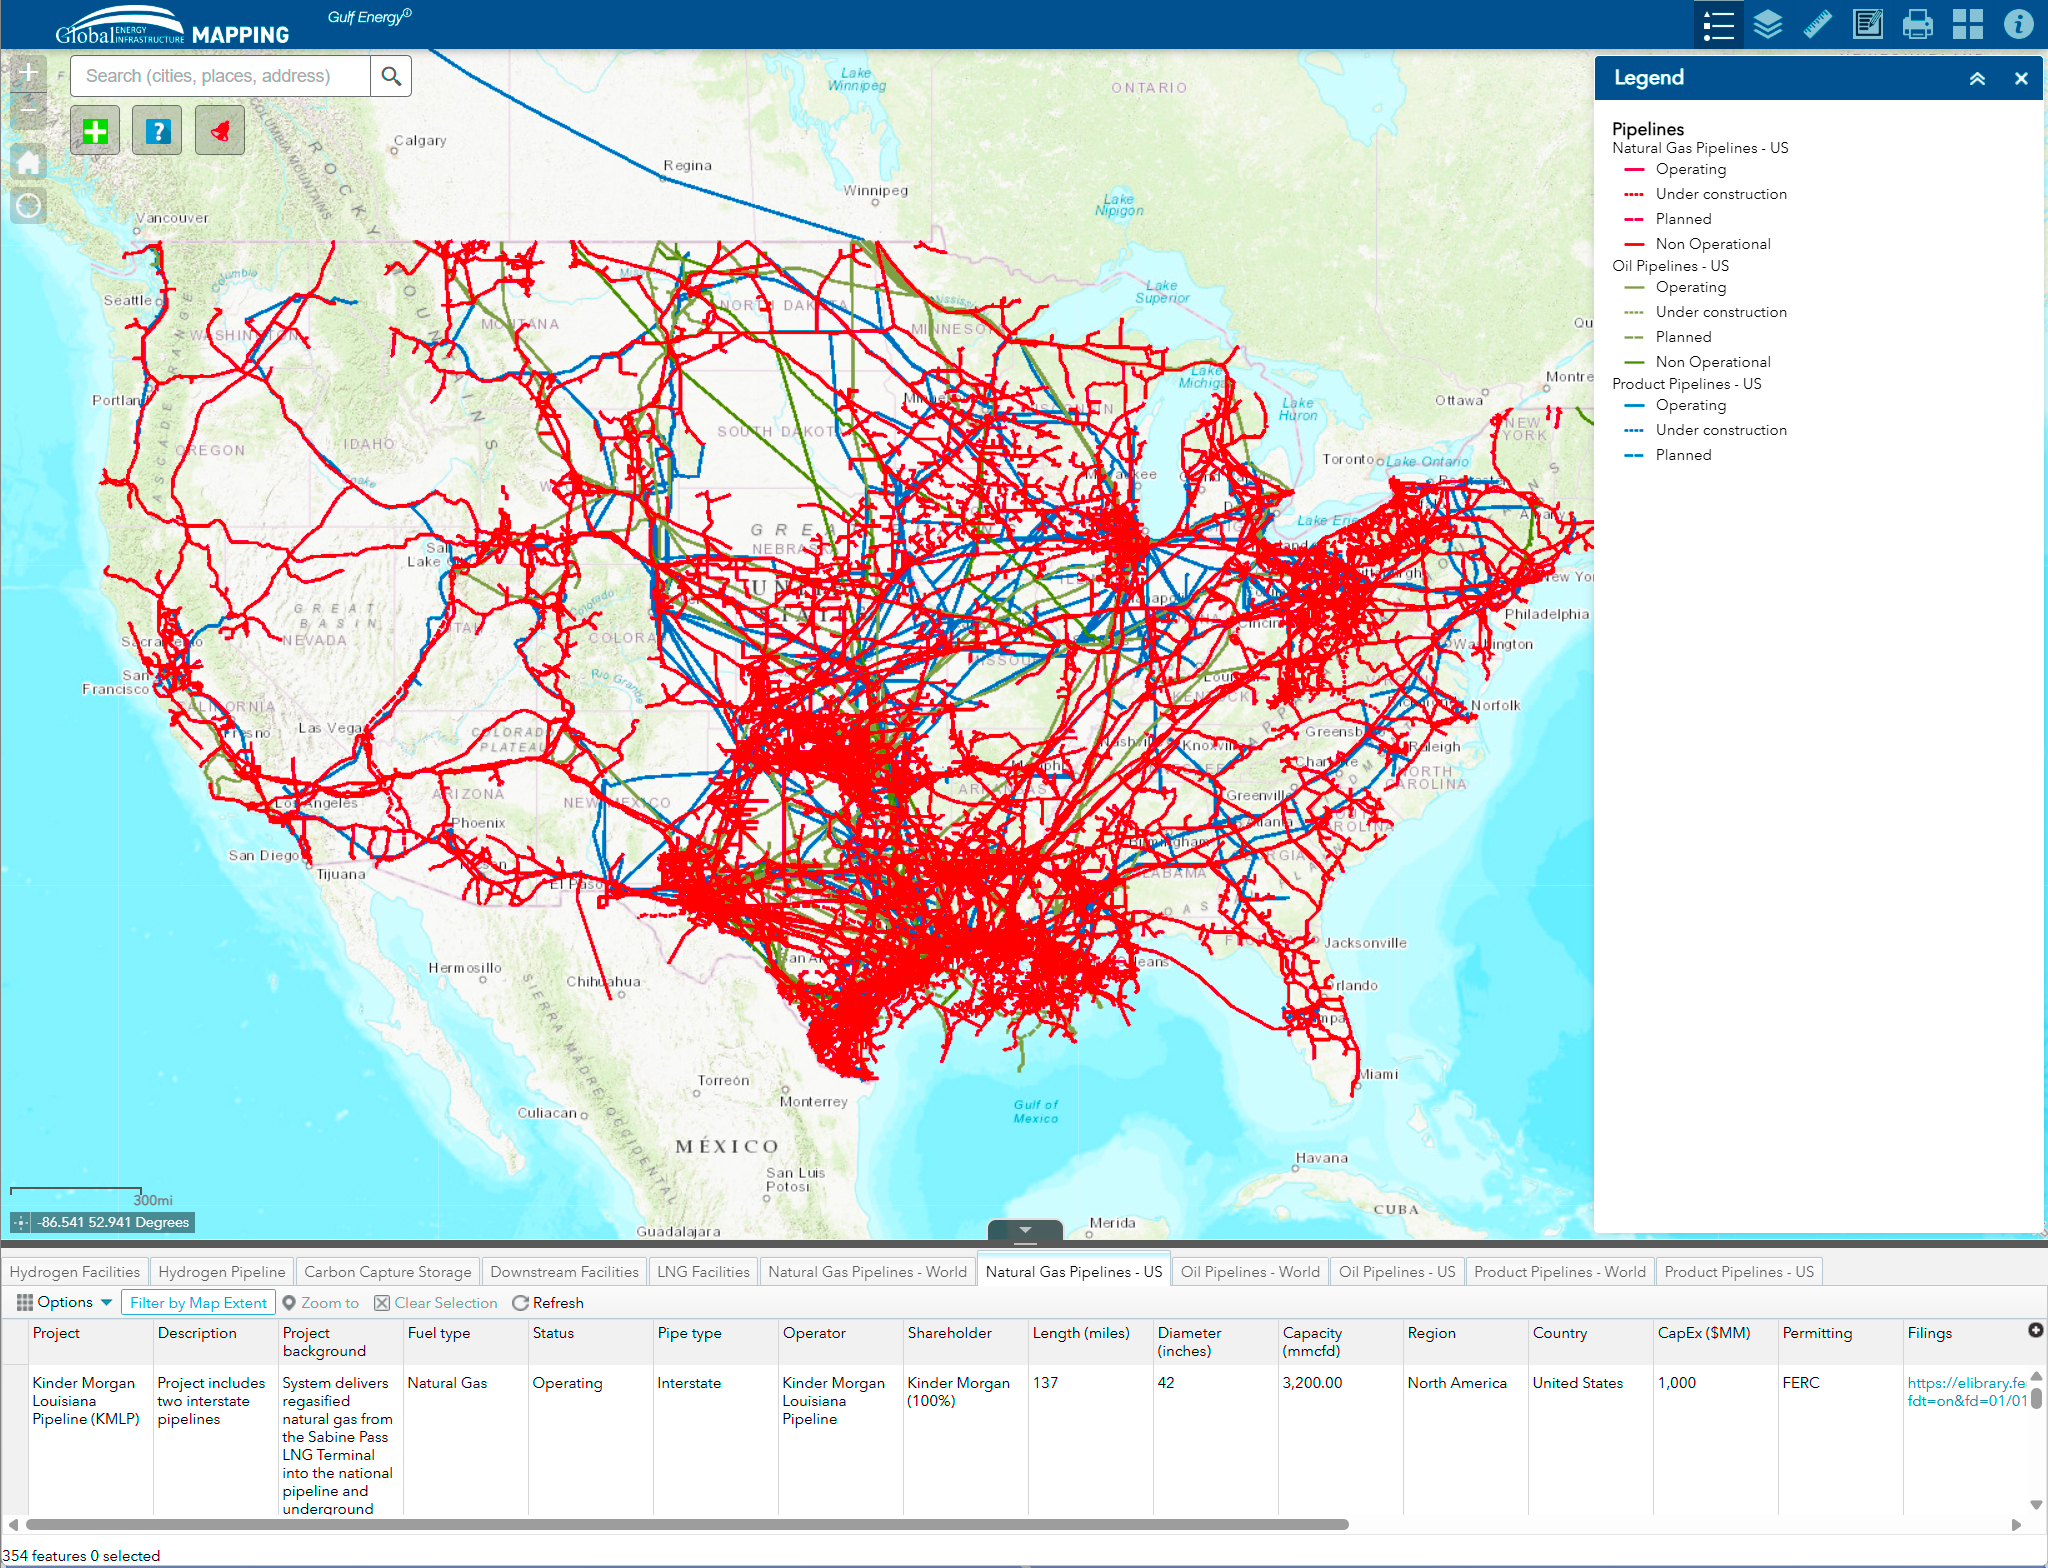
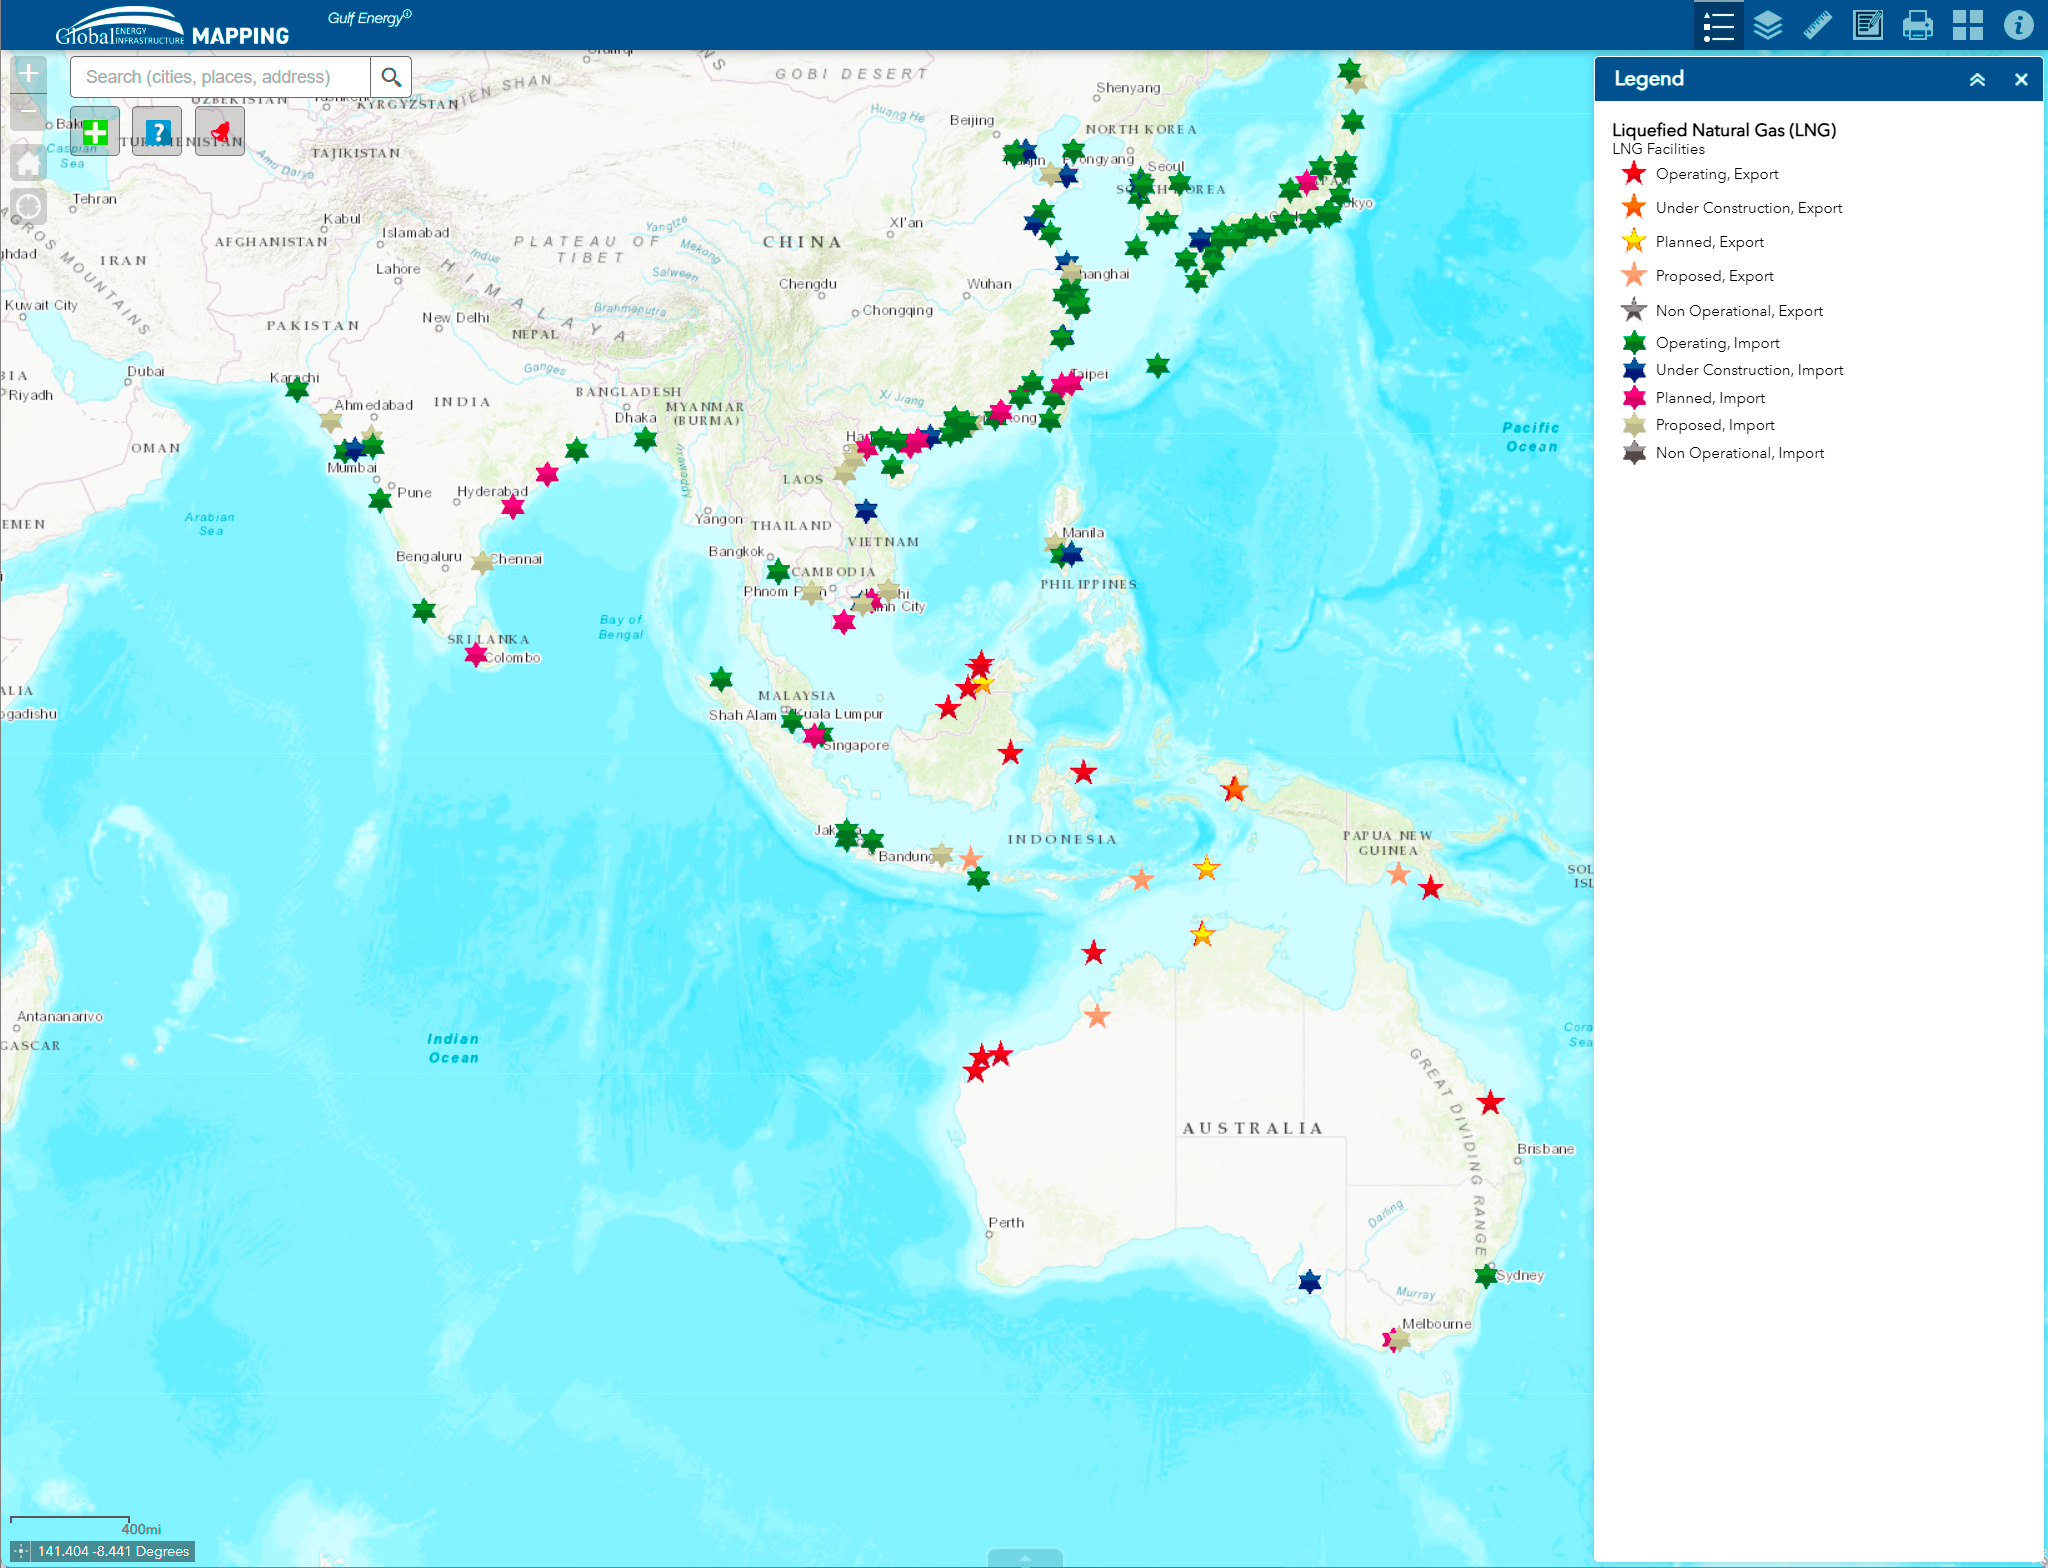
GEI Mapping (formerly Energy Web Atlas™) provides a dynamic, comprehensive view of worldwide energy assets. Utilizing advanced ESRI GIS technology, our platform visualizes the geographical distribution and connectivity of critical infrastructure. We cover the full spectrum of the industry from downstream (refining, petrochemicals, gas processing and biofuels) construction projects, global gas and oil pipeline infrastructure and LNG facilities to the evolving landscape of hydrogen and Carbon Capture Storage (CCS) ensuring you have the most up-to-date data for strategic decision-making.
Mapping Features
Overlay multiple datasets to identify patterns, connections, and opportunities across different asset types.
Combine refineries with pipeline networks, LNG terminals with shipping routes, or hydrogen projects with existing infrastructure
Visualize the entire energy ecosystem in context, revealing strategic insights impossible to see in isolation
Toggle layers on and off dynamically to focus on specific asset types
Create comprehensive views that show the full picture of regional energy infrastructure
Filter assets by capacity, ownership, status, technology, and dozens of other parameters to create custom views.
Search by operating company, project status (operating, under construction, planned), and capacity ranges
Filter by technical specifications like feedstock type, product slate, and commissioning dates
Handle complex queries across millions of data points in real-time
Seamlessly navigate from global overview to individual asset details with an intuitive, high-performance interface.
Start with worldwide views to understand regional concentrations and market dynamics
Drill down to country, or city level to examine specific infrastructure clusters
Click any asset to access comprehensive details including capacity, ownership, and operational history
Intelligent zoom maintains performance with thousands of assets, automatically adjusting detail levels
Export custom views, data subsets, and high-resolution maps for presentations and reports.
Generate high-quality map images for investor presentations and reports
Export underlying data as CSV files with all filters and parameters preserved for use in Excel
Create custom reports combining map visualizations with statistical summaries
Maintain full attribution and data lineage for compliance and verification